1/5


WavePlotter
1K+دانلودها
1.5MBاندازه
2.59(10-06-2023)آخرین نسخه
جزییاتدیدگاههانسخههاالمعلومات
1/5
توضیحات WavePlotter
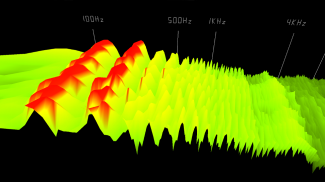
WavePlotter is a 3D spectrogram (waterfall plot) which can be used to analyse the change in the frequency content of audio signals over time. Change the input from a live source to a WAV - now with audio playback. Explore a signal with intuitive gestures and change settings using the slide out control panel.
Uses include:
- Live audio debugging. Making pinpointing troublesome frequencies in a room easy.
- Mastering. Bounce your files and check them for dominant elements.
- Articulation therapy. Feedback on this use especially would be very much appreciated.</br></br>
WavePlotter - نسخه 2.59
(10-06-2023)تازهها* allows switching between mono and stereo and channel selection* better support for USB audio* streamlined audio processing architecture* added control to pan center frequency* grid drawing mode and default view updated
WavePlotter - اطلاعات APK
نسخه APK: 2.59حزمة: com.cetl.waveplotter.appنام: WavePlotterاندازه: 1.5 MBدانلودها: 0نسخه : 2.59تاریخ انتشار: 2023-06-10 09:20:05حداقل صفحهنمایش: SMALLپردازشگر پشتیبانیشده:
شناسه بسته: com.cetl.waveplotter.appامضای SHA1: D8:AB:57:67:55:41:82:F5:76:C3:37:03:0C:AE:F9:03:CF:A7:CB:85برنامهنویس (CN): M Masonسازمان (O): منطقه (L): Readingکشور (C): UKاستان/شهر (ST): Berkshireشناسه بسته: com.cetl.waveplotter.appامضای SHA1: D8:AB:57:67:55:41:82:F5:76:C3:37:03:0C:AE:F9:03:CF:A7:CB:85برنامهنویس (CN): M Masonسازمان (O): منطقه (L): Readingکشور (C): UKاستان/شهر (ST): Berkshire
آخرین نسخه WavePlotter
2.59
10/6/20230 دانلودها1.5 MB اندازه
سایر نسخهها
2.58
19/11/20160 دانلودها1.5 MB اندازه
2.50
18/11/20160 دانلودها1 MB اندازه


اپلیکیشنها در دسته مشابه

شاید دوست داشته باشید...

English


